
Producers that do not hedge NGLs are overlooking a material source of risk to revenue, especially in oil and rich-gas plays where NGL contributions can be significant. In oil-focused plays, AEGIS data show NGLs can generate up to three times more revenue than natural gas. It’s possible to know precise exposures with a complete understanding of both contract terms and verified revenue receipts. Importantly, the underlying prices can be hedged via individual financial contracts. While liquidity does vary by purity product, it is generally sufficient out 12 to 24 months without meaningfully impacting market prices. Notably, some NGL prices are idiosyncratic and do not reliably correlate with crude oil or natural gas prices, reinforcing the benefit of explicitly hedging NGLs.
NGL revenue can be significant for oil plays and rich-gas plays. Knowing your exact exposure is key in formulating a risk mitigation strategy. Below are two composite examples, using AEGIS data, of both a Permian and a Midcontinent pure-play operator. Data from April-June 2025 was used in the analysis.
Permian operator revenues are dominated by oil, but NGLs are material and a source of idiosyncratic risk.
This is especially true as the Permian basin’s production gets gassier with rising gas-to-oil ratios (GORs).
AEGIS has a unique capability to understand producer NGL and residue production as well as revenue through its Revenue Intelligence set of products. The following will highlight some of the capabilities of Revenue Intelligence to fully understand the complete production stream.
The chart below shows the production split of a typical Permian oil and gas producer. The quantities are wellhead volumes, before adjustments for revenue interest (i.e. represent 8/8ths). Units are converted to barrels of oil equivalent or BOE for comparison. In our example, the typical Permian producer was 47% oil, 25% NGLs and 28% dry gas or residue gas by volume in the second quarter of 2025.
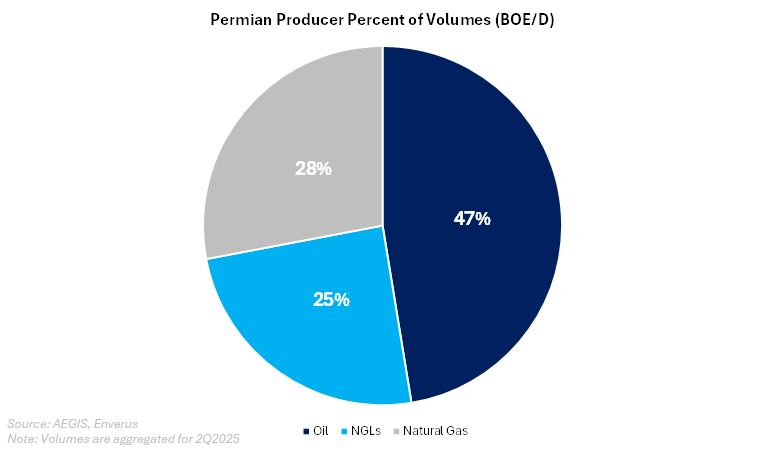
Each producing basin has its own quirks and nuances that can set it apart from another basin. In our Permian example, oil is king, while gas volume is smaller, and West Texas gas prices often make headlines for being below zero.
In the graphic below, we have used our AEGIS proprietary model to aggregate a sample of oil producers’ processing-plant statements and contracts to derive revenue by stream and by purity product. As a note, we are still using 8/8ths production volumes.
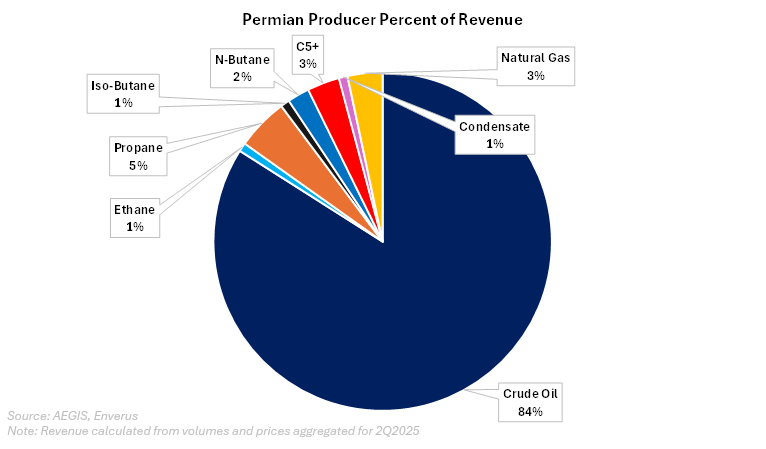
It is no surprise that crude oil represented most of the revenue, 84%, for the typical Permian operator. And, due to the low natural gas prices in West Texas and New Mexico, residue gas represented between 3-4% of total revenue in this partial sample of AEGIS customers.
NGLs represented about 13% of total revenue. Propane alone accounted for 5% of revenue, more than total revenue from residue gas!
We highlight this fact as some producers hedge natural gas but not the NGLs, even when one purity product was more of the revenue pie than the residue.
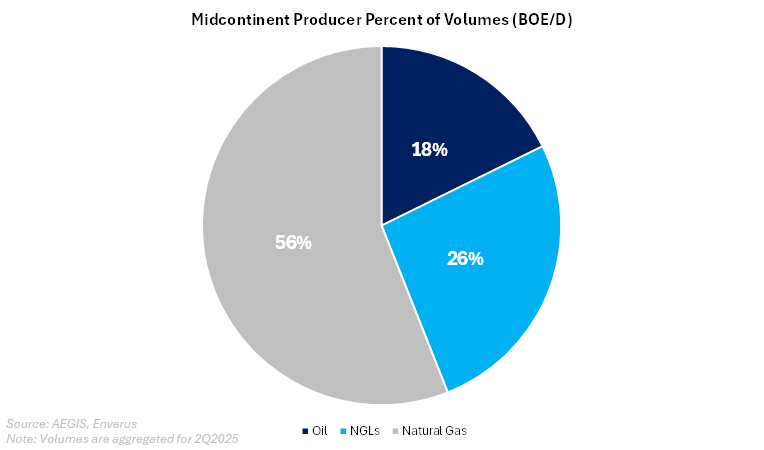
Midcontinent producers, western Oklahoma in our example, are typically exposed to more NGLs price risk than are their oilier peers.
In our representative Midcontinent producer, volume and revenue splits are very different than those in the Permian basin. Again, we use AEGIS Revenue Intelligence to get exact volumes for a useful sample of meters going to processing plants. Compared to the Permian basin, Midcontinent crude oil volumes were a much smaller proportion; NGLs and natural gas, larger. Here we show crude oil represented 18% of wellhead volumes, 26% NGLs, and the majority (56%) residue or dry-gas production.
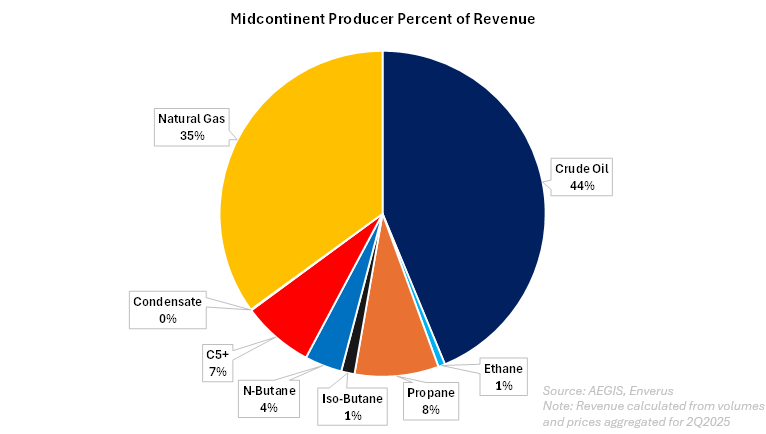
That’s volume, but what about revenue? The revenue breakdown for our typical Midcontinent producers showed 35% of revenue came from residue gas and 44% from crude oil. Much of the increased share of natural gas is because prices in the Midcontinent were not near zero as they were in the Permian basin.
NGLs as a basket accounted for the remaining 21% of revenue. Among the NGLs, the biggest proportion came from propane – just like it did in the Permian.
A couple things to be aware of when tracking these datapoints: First, prices for each of the products change from month to month. Revenue percentages can see major changes with how volatile these products’ prices can be. Second, depending on drilling schedules, product volume mixes to change over time.
Our Revenue Intelligence software keeps track of all these metrics over time – plus others not shown, which include T&F, fees, etc., allowing you to understand at the most granular level your production and revenue. There is no single tool that can extract and normalize your volumes, revenue, and fees as quickly or as accurately as Revenue Intelligence.
Each NGL (ethane, propane, normal butane, isobutane, and “natural gasoline” or “pentane plus”) in the barrel can be hedged independently using its own financial contract. The two major pricing points for NGLs are Mt. Belvieu (TX) or Conway (KS). If a producer receives payment for physical NGLs on one of these indices, there is usually no additional regional price risk (like their could be for natural gas, for example).
Liquidity is usually sufficient for hedging. Liquidity varies between the contracts with ethane and propane being the most liquid, while the butanes and natural gasoline have less. Even so, each purity product can typically be hedged up to 24 months forward with minimal price impact. The larger the producer, the more caution and planning are needed to trade within market liquidity.
It is a common misconception that NGL purity products’ prices correlate to WTI or Henry Hub prices. It is true that ethane prices correlate somewhat to natural gas prices, and the other NGLs (propane, butanes, and natural gasoline) correlate somewhat to WTI prices. But how much?
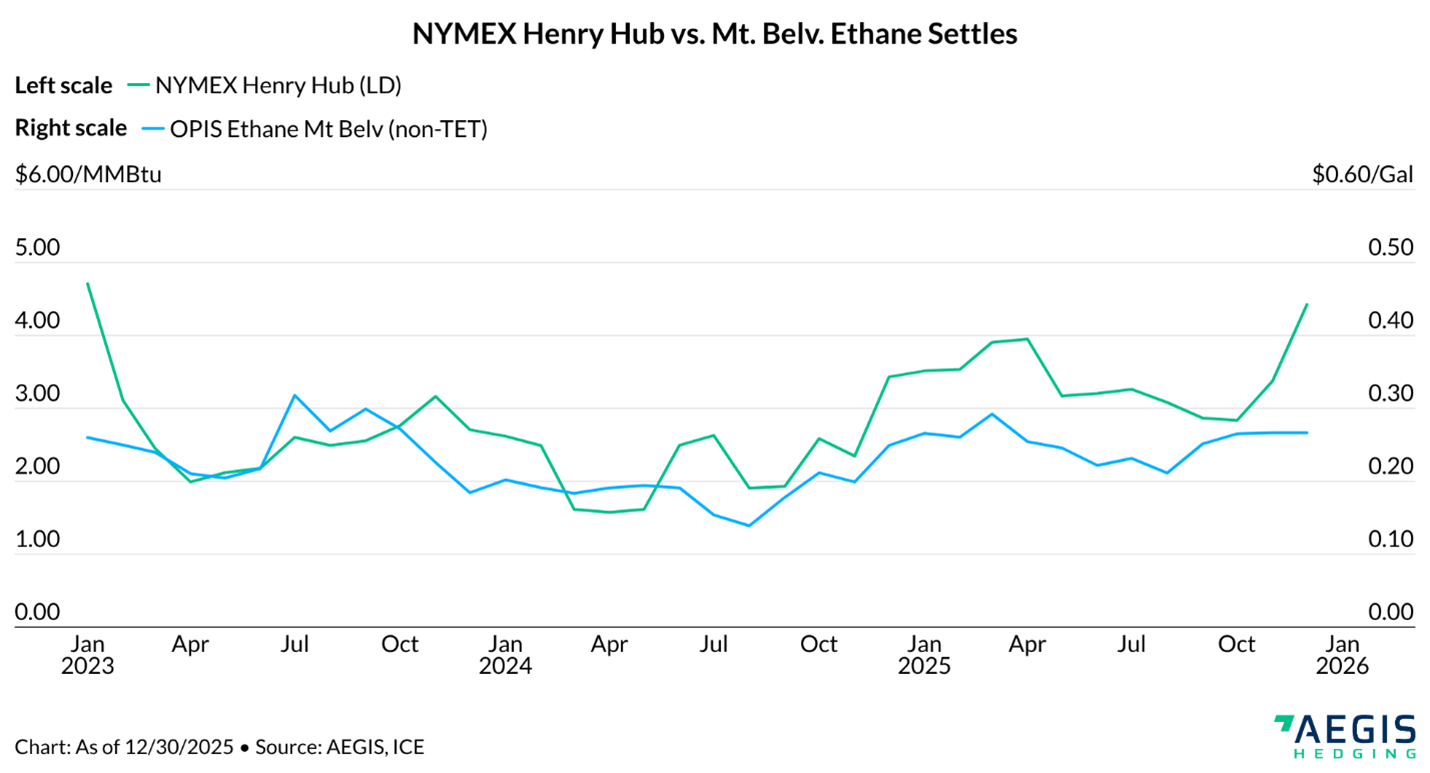
Below is a chart of the historical settlement prices of Mont Belvieu ethane and Henry Hub (LD) natural gas for the past three years. On the surface, these two price curves (indices) look to be well correlated, with prices rising and falling together.
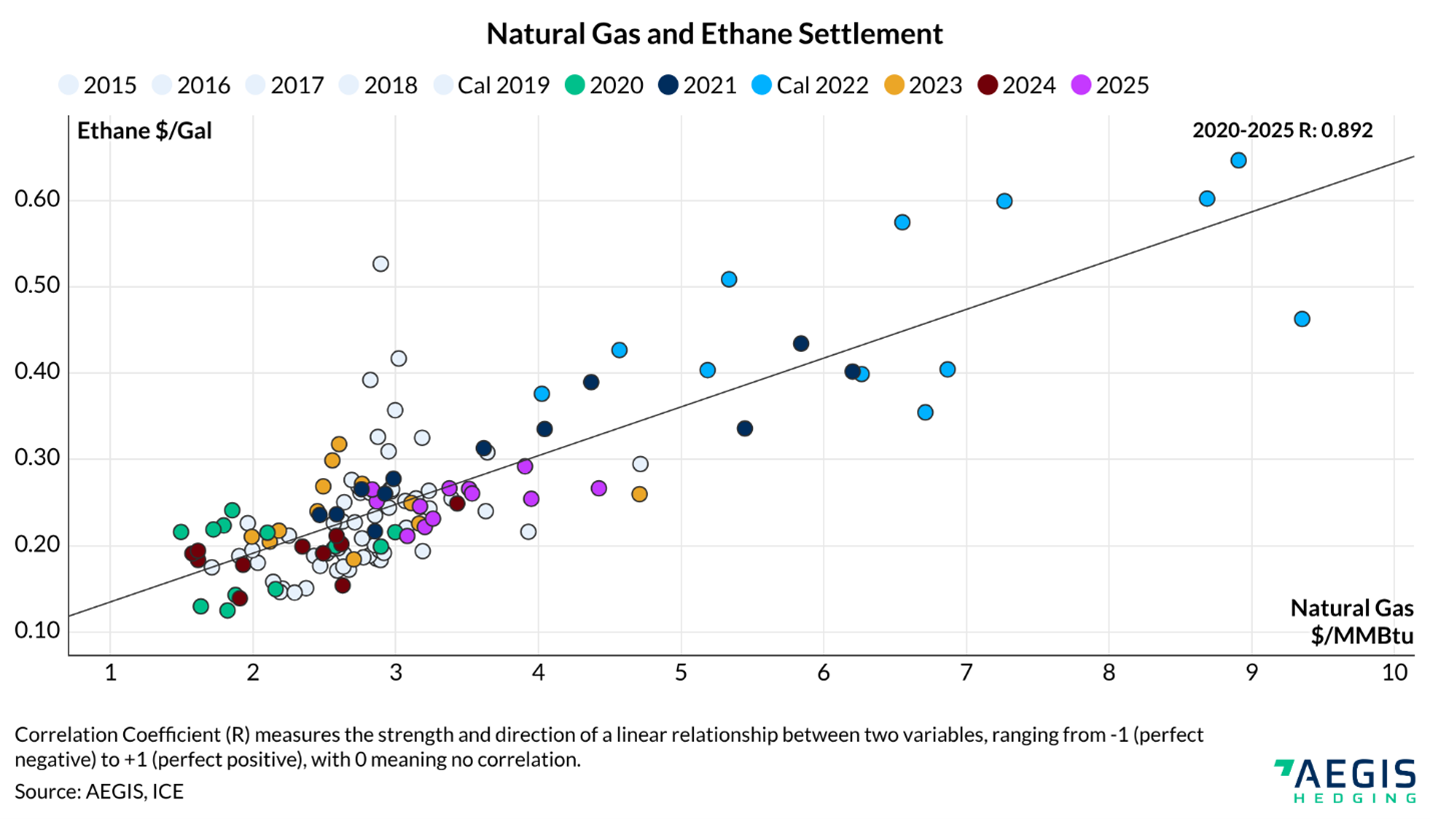
This correlation is confirmed when the settlements are plotted together as a scatterplot, shown below. The monthly settled price for Henry Hub is plotted on the horizontal axis while the monthly settled price for Ethane is plotted on the vertical axis.
The two streams have a correlation coefficient (R) of 0.89. The correlation coefficient (R) measures the strength and direction of a linear relationship between two variables, ranging from -1 (perfect negative) to +1 (perfect positive), with “zero” meaning no correlation. In hedge accounting, historically 0.80 has been used as the minimum acceptable correlation coefficient.
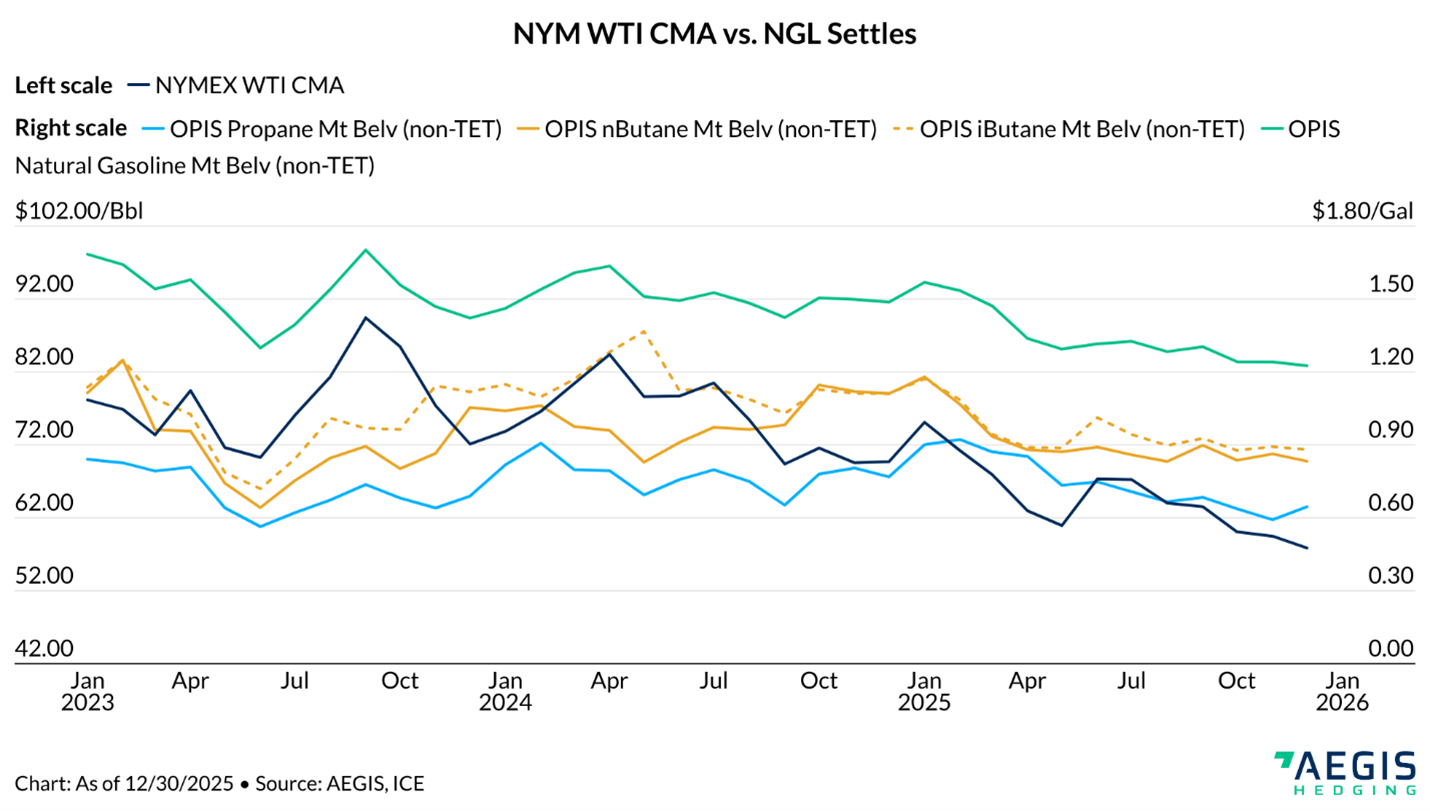
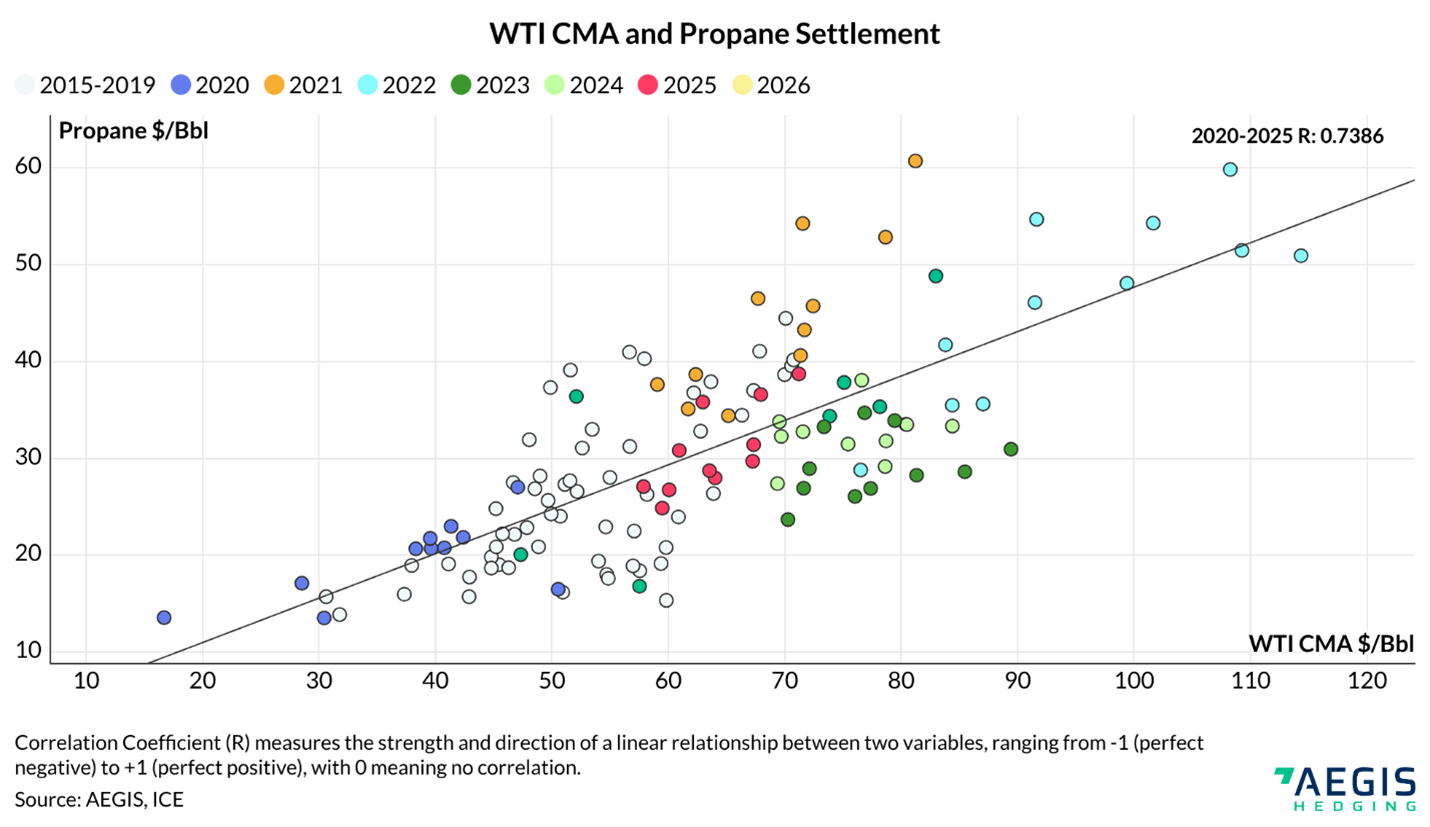
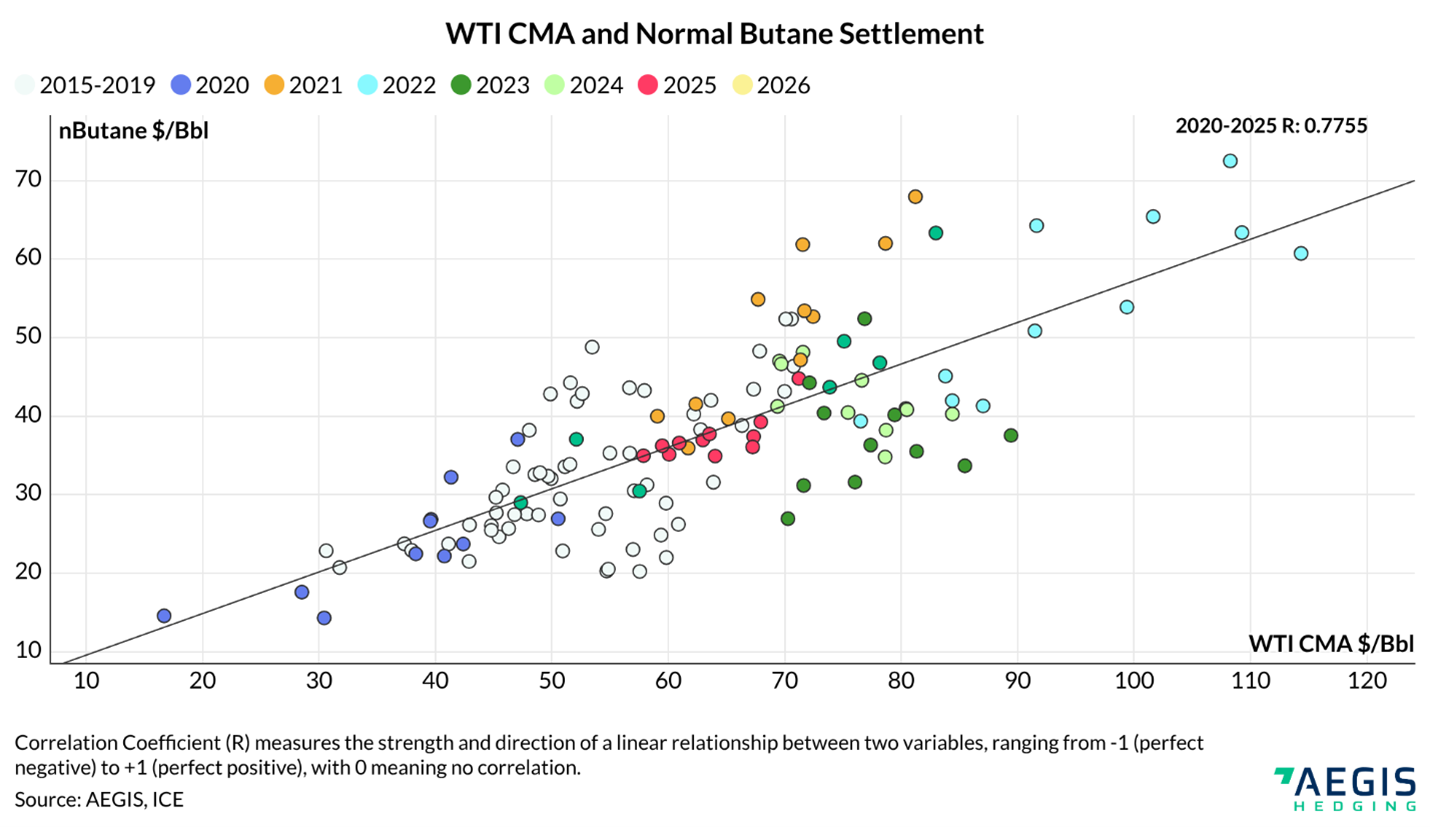
None of the other four NGL purity products have a correlation coefficient above 0.70 when compared against Henry Hub. Generally, the other NGLs are referenced to WTI as a potential proxy. Below are charts of the historical settles of propane, butane, isobutane, natural gasoline and WTI from 2023 through 2025.
Again, each of the NGL streams looks to be correlated well with WTI. Are they?
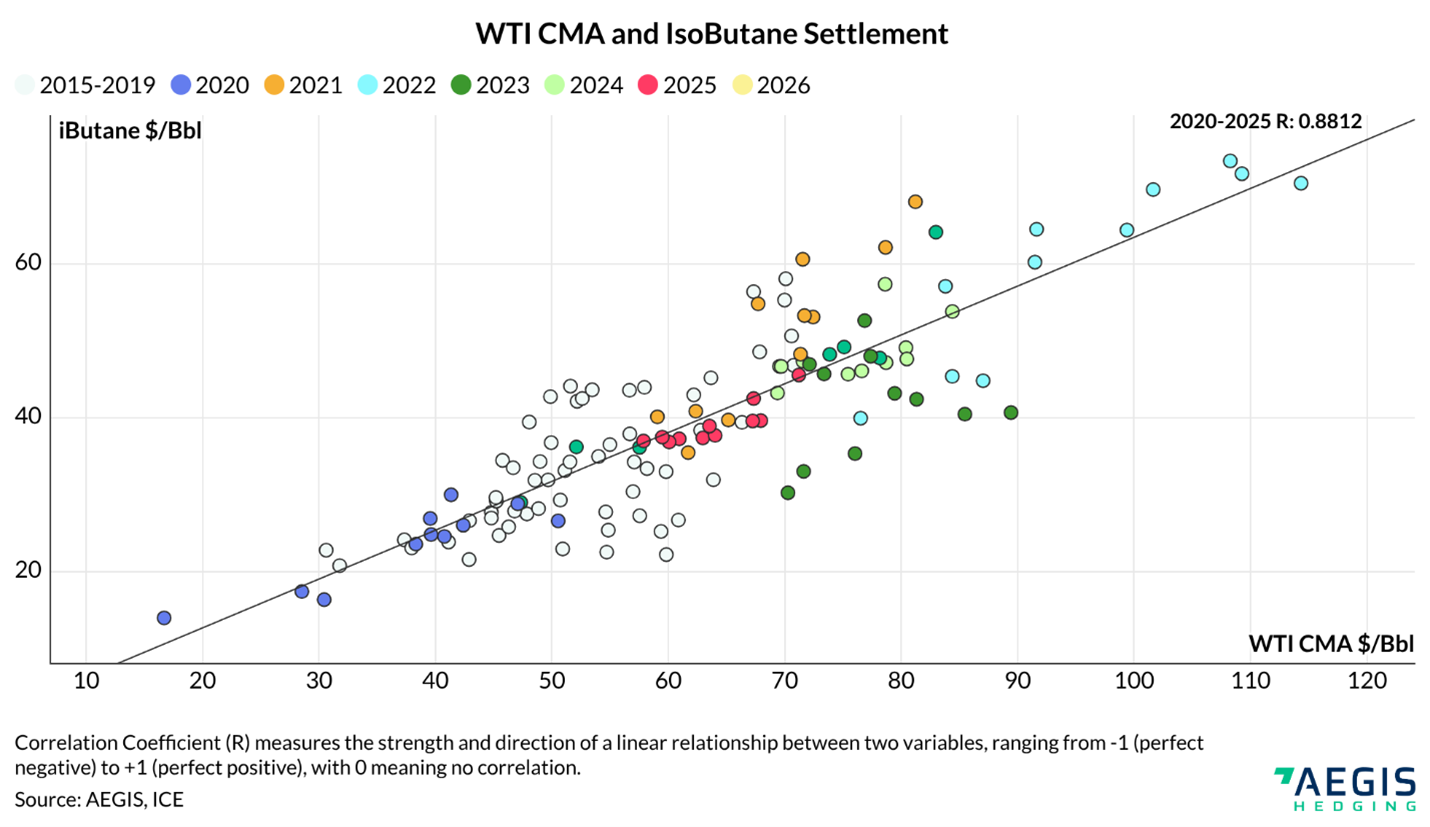
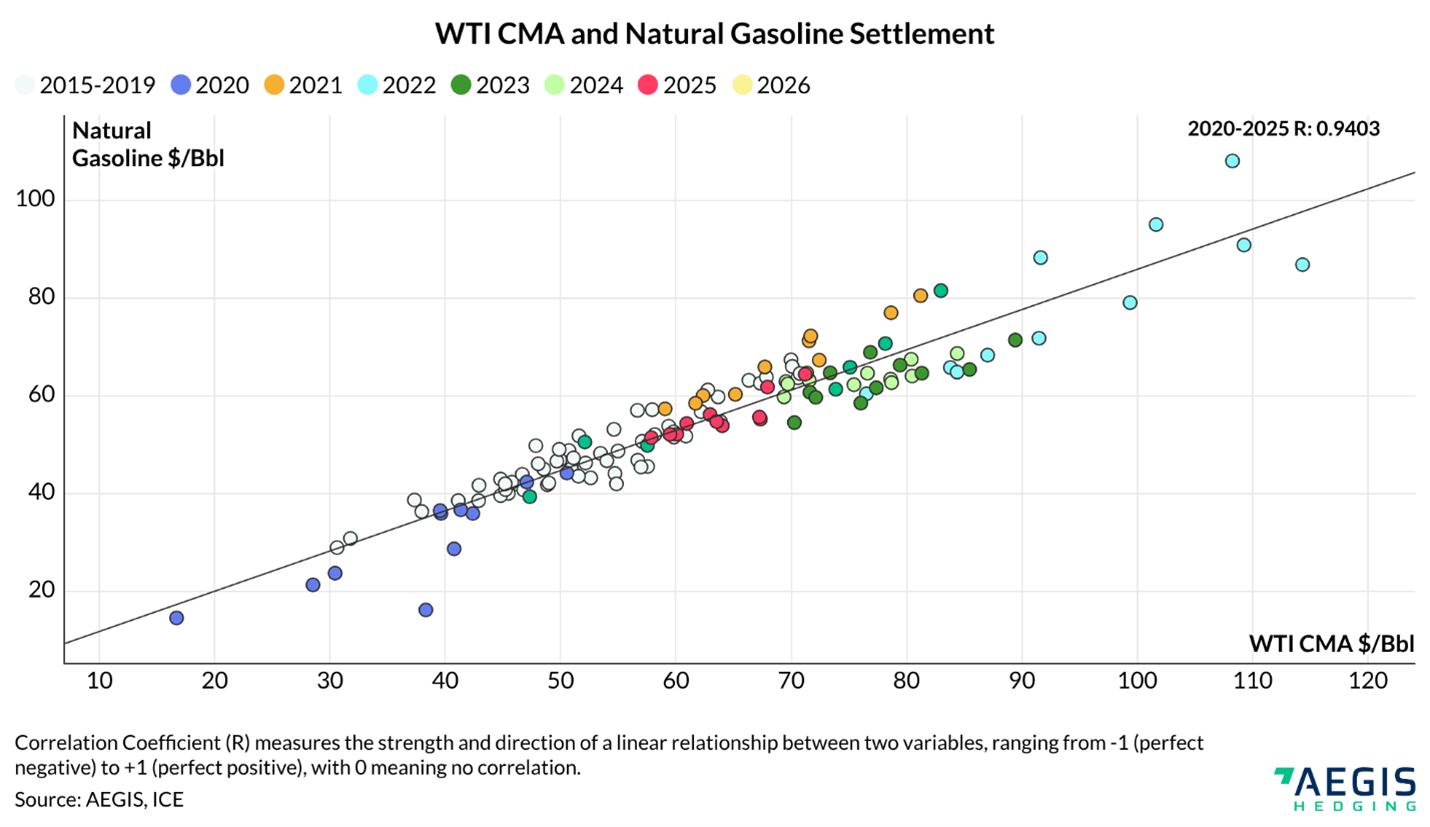
Only two have a correlation coefficient above 0.80: isobutane (iC4) and natural gasoline (C5+). Below is a table of each of the NGL streams’ coefficients compared to WTI over the past six years.
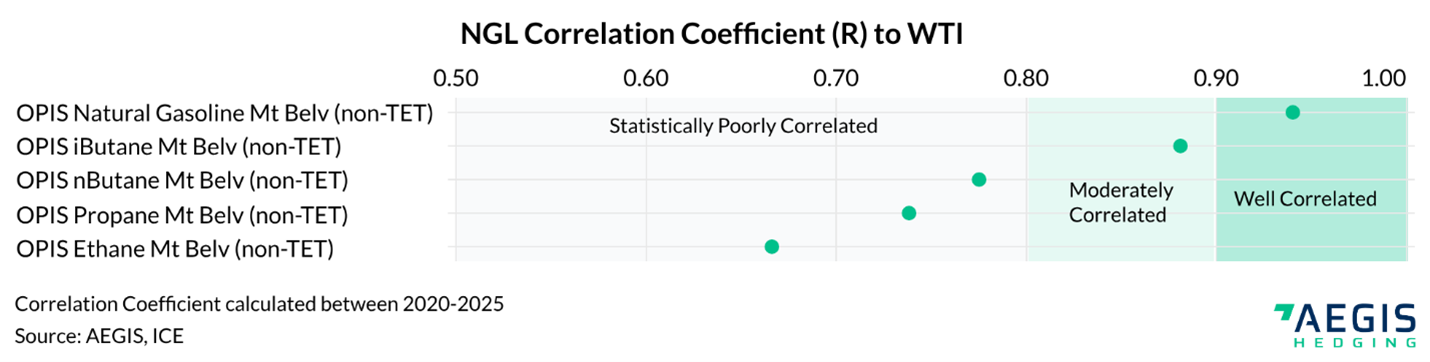
Natural gasoline is the most chemically similar to crude oil among the NGLs, and it is sometimes sold in the physical market on a WTI basis. The high correlation makes sense.
Isobutane is commonly used in refineries as an input to make high-octane gasoline, so its link to crude oil prices also is reasonable.
The rather low correlation coefficient of both ethane, propane, and normal butane is expected, as each has its own unique supply/demand fundamentals outside the influence of oil markets. We have also provided individual product scatterplots vs. WTI (see below), going back to 2015.
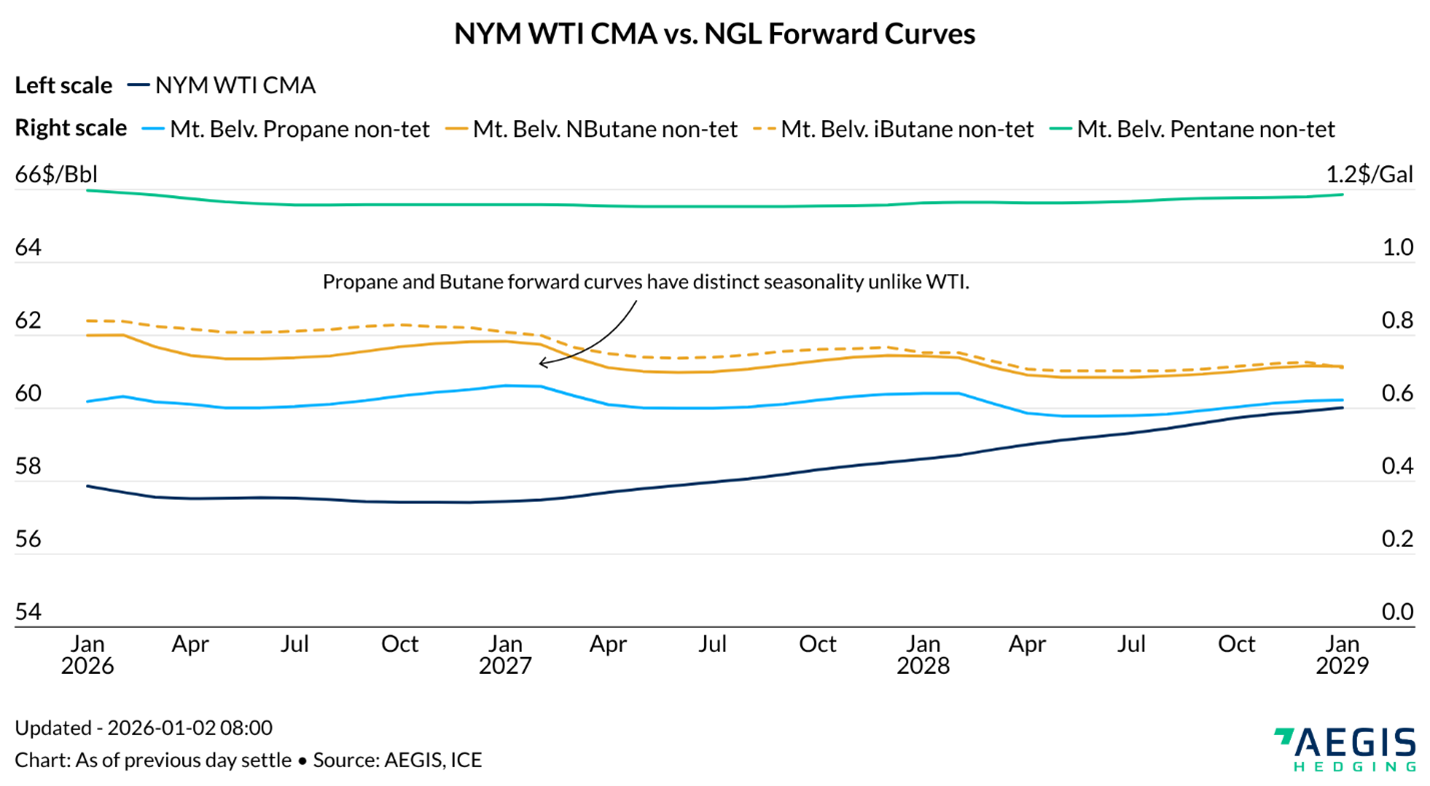
Another noticeable difference is the seasonality within the price of propane and normal butane when compared to crude oil.
The chart below shows the forward curves for WTI, propane, butane, isobutane and natural gasoline as of the settle on January 1, 2026. It’s clear that propane and the butanes follow a seasonal pattern, similar to natural gas, where demand and therefore price rise during winter and relax during summer. This is not a pattern observed in the WTI forward curve. The seasonal influences on propane and butane reduce the price correlation to WTI. This means seasonal patterns create basis risk between NGLs and WTI.
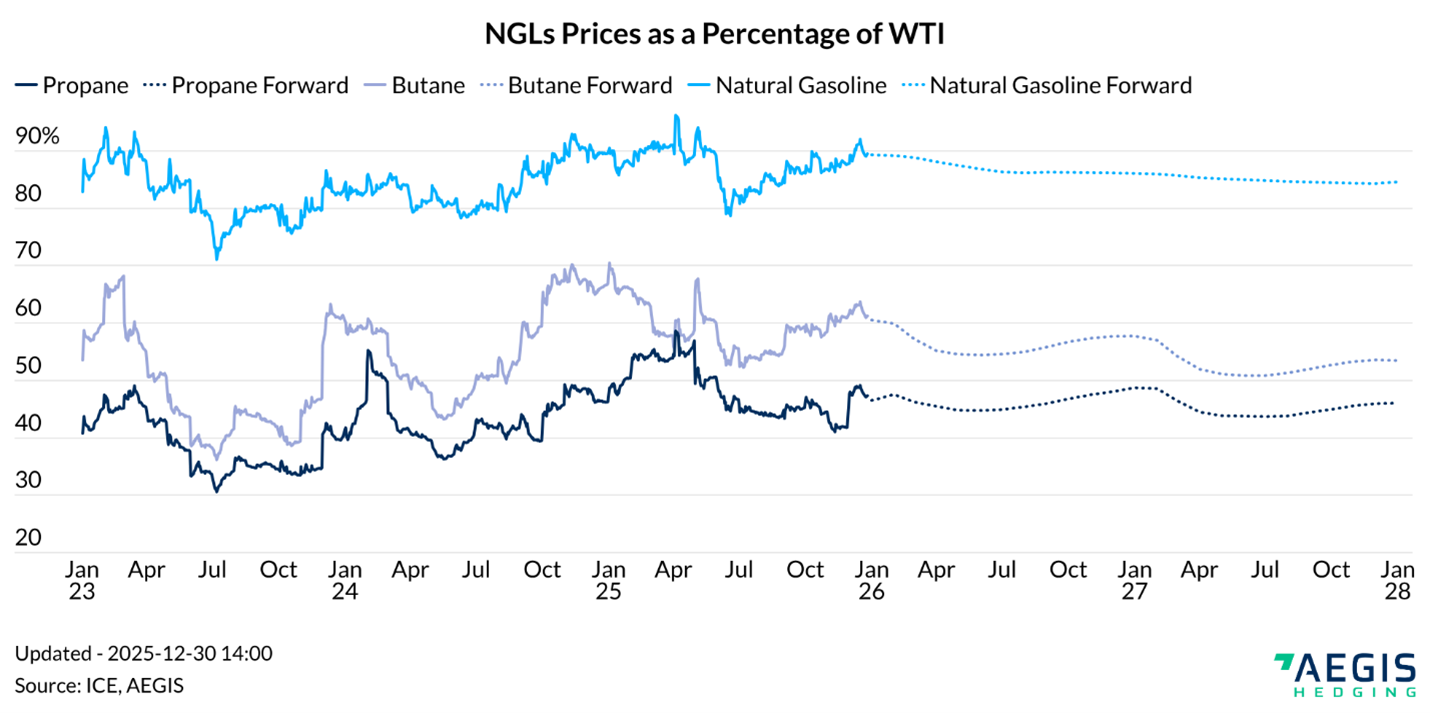
Because of the availability, liquidity, and lack of direct correlation between some NGLs and WTI, we typically do not advise clients to “proxy hedge” – that is, using WTI hedges to cover NGL sales.
The low price correlation and the unpredictable relationship between NGLs as a percentage of WTI, shown below, mean risk is not protected 1:1. At times when NGL prices decreased more than WTI, there was lost opportunity; at times when NGL prices decreased while WTI rose, the hedge may not have worked and could have destroyed value.
A disciplined NGL hedging program requires a clear understanding of historical and forecasted NGL production by purity product over the one- to two-year hedging horizon, supported by robust monitoring of relevant pricing curves and integrated valuation alongside crude oil and natural gas hedges. Adopting this approach represents industry best practices and enables more effective risk management. We recommend evaluating the potential benefits of NGL hedging within this framework and engaging with your AEGIS trader to assess appropriate strategies. If you’d like to stay up-to-date on how supply/demand fundamentals are influencing the individual purity products, you can do so here.
